Market Outlook
July 6, 2017
Market Cues
Domestic Indices
Chg (%)
(Pts)
(Close)
Indian markets are likely to flat tracking SGX Nifty and global indices.
BSE Sensex
0.1
36
31,246
US markets were mixed yesterday as Federal Reserve policy meeting minutes
Nifty
0.3
24
9,638
indicated that the reduction in the central bank’s economy-boosting balance sheet
Mid Cap
1.0
143
14,902
could begin soon. The Dow edged down 1.10 points or less than a tenth of a
Small Cap
1.1
174
15,741
percent to 21,478, the Nasdaq climbed 0.7 percent to 6,151 and the S&P 500 rose
Bankex
0.6
168
26,444
0.2 percent to 2,433.
The UK market ended a wobbly Wednesday trading session slightly higher, with
Global Indices
Chg (%)
(Pts)
(Close)
investors taking a cautious approach after weaker-than-expected data on the key UK
services sector as well as rising geopolitical tensions over North Korea. The FTSE
Dow Jones
(0.0)
(1)
21,478
100 rose 0.1% to 7,368, after swinging in and out of losses throughout the session.
Nasdaq
0.7
41
6,151
The London benchmark on Tuesday declined 0.3%, the fifth decline in six sessions.
FTSE
0.1
10
7,368
In the domestic markets, the benchmark Sensex inched up 0.11% to close at 31,246
Nikkei
0.2
49
20,082
as domestic institutional investors stuck to unabated buying in range-bound trade on
Hang Seng
0.5
133
25,522
Wednesday. The broader Nifty managed to hold on to its key 9,600- mark and
Shanghai Com
0.8
24
3,207
ended the day at 9,638, up 0.25%. Traders opted for small buying, while stock
specific actions led the key indices to remain in positive terrain.
Advances / Declines
BSE
NSE
News Analysis
Advances
1,706
1,122
Lupin Ltd News Update
Declines
988
576
Tejas Networks ltd IPO - Book profit
Unchanged
141
74
Detailed analysis is on Pg2
Investor’s Ready Reckoner
Volumes (` Cr)
Key Domestic & Global Indicators
BSE
3,140
Stock Watch: Latest investment recommendations on 150+ stocks
NSE
22,034
Refer Pg6 onwards
#Net Inflows (` Cr)
Net
Mtd
Ytd
Top Picks
CMP
Target
Upside
FII
(896)
(896)
55,012
Company
Sector
Rating
(`)
(`)
(%)
MFs
871
871
37,865
Blue Star
Capital Goods
Buy
612
760
24.3
Dewan Housing FinanceFinancials
Buy
436
520
19.3
Top Gainers
Price (`)
Chg (%)
Mahindra Lifespace
Real Estate
Buy
439
522
19.0
Navkar Corporation
Others
Buy
210
265
26.3
Idfc
60
10.1
KEI Industries
Capital Goods
Accumulate
234
258
10.2
Jpassociat
21
8.0
More Top Picks on Pg3
Raymond
815
6.4
Key Upcoming Events
Ibrealest
209
6.3
Previous Consensus
Date
Region
Event Description
Jisljaleqs
107
5.7
Reading Expectations
Jul 6, 2017
US
Initial Jobless claims
244.00
243.00
Jul 7, 2017
US
Change in Nonfarm payrolls
138.00
177.00
Top Losers
Price (`)
Chg (%)
Jul 7, 2017
UK
Industrial Production (YoY)
(0.80)
0.20
Religare
151
(4.8)
Jul 7, 2017
US
Unnemployment rate
4.30
4.30
Mfsl
597
(3.8)
Jul 10, 2017
India
Industrial Production YoY
3.10
Cub
177
(2.8)
More Events on Pg4
Intellect
129
(2.2)
Tatacomm
677
(1.9)
#as on 5t July, 2017
Market Outlook
July 6, 2017
News Analysis
Lupin Ltd News Update
Lupin Limited announced the launch of its Moxifloxacin Hydrochloride Ophthalmic
solution USP, 0.5% (base) having received an approval from the USFDA earlier.
Lupin’s Moxifloxacin Hydrochloride Ophthalmic solution USP, 0.5% (base), is an
AT1 rated generic equivalent of Novartis Pharma Corp’s Vigamox Ophthalmic
solution. It is indicated for the treatment of bacterial conjunctivitis caused by
susceptible strains of the organisms. Vigamox Ophthalmic solution had US sales of
US$267.9mn (IMS MAT March 2017). The product is likely to contribute around
US$20-25mn. We maintain our BUY recommendation on the stock with a price
target of `1526.
Tejas Networks ltd IPO - Book profit
Tejas Networks Limited, concluded its initial public offer (IPO) in mid of June-2017
and raised `.777cr. We had a ‘SUBSCRIBE’ rating on Tejas Networks considering
a) strong revenue CAGR of 24.2% over FY2013-17 b) turnaround from loss of
`79cr in FY13 to PAT of `64cr in FY17 c) 500 bps improvement in RoE from 8% in
FY16 to 12.9% in FY17, d) asset light business model and strong operating
leverage and e) an experienced management team. Its post-IPO debt free balance
sheet coupled with the government’s push for digital India is expected to support
the growth momentum going ahead. Post listing, the stock has appreciated 18%
and at the CMP, it trades at 19.20x of FY19E EPS. We believe this is a fair
valuation and it’s time to book profit.
Economic and Political News
India Monsoon Rainfall 5% Above Normal July 5
India's growth prospects improve as reforms pay off: IMF
India services sector PMI at an 8-month high of 53.1 in June
Non-food credit growth at two-month high
India Watchdog to Monitor Pricing in New Tax Regime by July-End
Corporate News
ABC Bearings hits upper circuit on merger nod
ICICI Bank, others move UK court to recover $600-mn loans to Essar arm
NMDC lowers iron ore prices by 8-9% amid supply glut, demand slump
Note ban, RERA effect: Residential realty launches down 41% in H1 of FY18
Market Outlook
July 6, 2017
Top Picks HHHHH
Market Cap
CMP
Target
Upside
Company
Rationale
(` Cr)
(`)
(`)
(%)
Strong growth in domestic business due to its leadership
in acute therapeutic segment. Alkem expects to launch
Alkem Laboratories
21,950
1,836
2,161
17.7
more products in USA, which bodes for its international
business.
We expect the company would report strong profitability
Asian Granito
1,341
446
480
7.7
owing to better product mix, higher B2C sales and
amalgamation synergy.
Favourable outlook for the AC industry to augur well for
Cooling products business which is out pacing the market
Blue Star
5,849
612
760
24.3
growth. EMPPAC division's profitability to improve once
operating environment turns around.
With a focus on the low and medium income (LMI)
consumer segment, the company has increased its
Dewan Housing Finance
13,665
436
520
19.3
presence in tier-II & III cities where the growth opportunity
is immense.
Loan growth is likely to pick up after a sluggish FY17.
Karur Vysya Bank
8,684
144
160
11.3
Lower credit cost will help in strong bottomline growth.
Increasing share of CASA will help in NIM improvement.
Economic recovery to have favourable impact on
advertising & circulation revenue growth. Further, the
Jagran Prakashan
6,017
184
225
22.2
acquisition of a radio business (Radio City) would also
boost the company's revenue growth.
High order book execution in EPC segment, rising B2C
KEI Industries
1,822
234
258
10.2
sales and higher exports to boost the revenues and
profitability
Speedier execution and speedier sales, strong revenue
Mahindra Lifespace
2,251
439
522
19.0
visibilty in short-to-long run, attractive valuations
Massive capacity expansion along with rail advantage at
Navkar Corporation
2,993
210
265
26.3
ICD as well CFS augurs well for the company
Strong brands and distribution network would boost
Siyaram Silk Mills
2,062
2,200
2,500
13.6
growth going ahead. Stock currently trades at an
inexpensive valuation.
Market leadership in Hindi news genre and no.
2
viewership ranking in English news genre, exit from the
TV Today Network
1,497
251
344
37.1
radio business, and anticipated growth in ad spends by
corporates to benefit the stock.
Source: Company, Angel Research,
Market Outlook
July 6, 2017
Key Upcoming Events
Global economic events release calendar
Bloomberg Data
Date
Time
Country
Event Description
Unit
Period
Last Reported
Estimated
Jul 06, 2017
6:00 PMUS
Initial Jobless claims
Thousands
Jul 1
244.00
243.00
Jul 07, 2017
6:00 PMUS
Change in Nonfarm payrolls
Thousands
Jun
138.00
177.00
2:00 PMUK
Industrial Production (YoY)
% Change
May
(0.80)
0.20
6:00 PMUS
Unnemployment rate
%
Jun
4.30
4.30
Jul 10, 2017
5:30 PMIndia
Industrial Production YoY
% Change
May
3.10
Jul 12, 2017
7:00 AMChina
Consumer Price Index (YoY)
% Change
Jun
1.50
1.50
2:00 PMUK
Jobless claims change
% Change
Jun
7.30
Jul 13, 2017
US
Producer Price Index (mom)
% Change
Jun
(0.70)
China
Exports YoY%
% Change
Jun
8.70
9.00
Jul 14, 2017
India
Imports YoY%
% Change
Jun
33.10
India
Exports YoY%
% Change
Jun
8.30
6:45 PMUS
Industrial Production
%
Jun
-
0.30
6:00 PMUS
Consumer price index (mom)
% Change
Jun
(0.10)
0.10
12:00 PMIndia
Monthly Wholesale Prices YoY%
% Change
Jun
2.17
Jul 17, 2017
7:30 AMChina
Industrial Production (YoY)
% Change
Jun
6.50
6.50
7:30 AMChina
Real GDP (YoY)
% Change
2Q
6.90
6.80
Jul 18, 2017
2:00 PMUK
CPI (YoY)
% Change
Jun
2.90
2:30 PMEuro Zone
Euro-Zone CPI (YoY)
%
Jun F
1.30
Jul 19, 2017
6:00 PMUS
Housing Starts
Thousands
Jun
1,092.00
1,190.00
6:00 PMUS
Building permits
Thousands
Jun
1,168.00
1,205.00
Jul 20, 2017
7:30 PMEuro Zone
Euro-Zone Consumer Confidence
Value
Jul A
(1.30)
Source: Bloomberg, Angel Research
Market Outlook
July 6, 2017
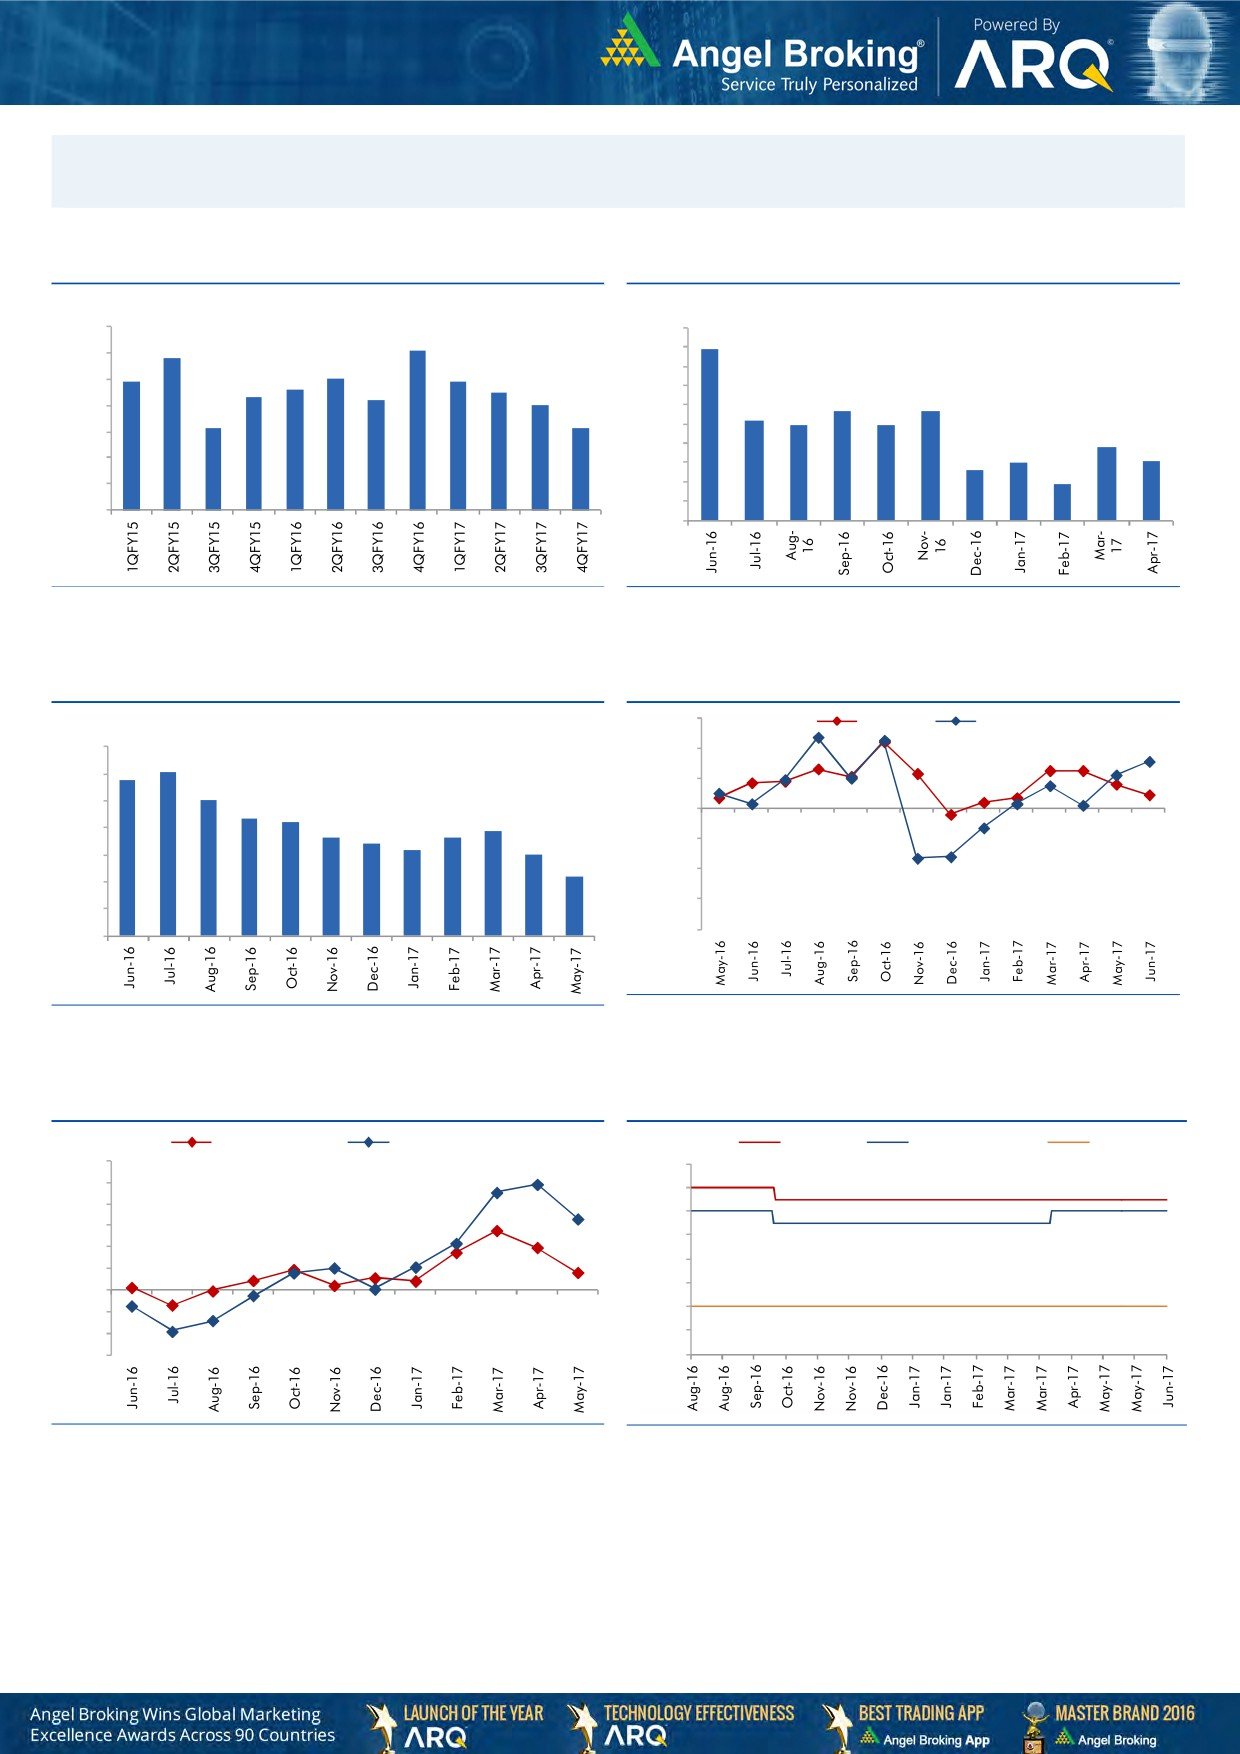
Macro watch
Exhibit 1: Quarterly GDP trends
Exhibit 2: IIP trends
(%)
(%)
10.0
10.0
9.1
8.9
8.8
9.0
9.0
7.9
8.0
7.9
8.0
7.6
7.5
8.0
7.3
7.2
7.0
7.0
5.7
5.7
7.0
6.0
5.2
6.1
6.1
4.9
4.9
6.0
5.0
3.8
4.0
3.0
3.1
2.6
5.0
3.0
1.9
4.0
2.0
1.0
3.0
-
Source: CSO, Angel Research
Source: MOSPI, Angel Research
Exhibit 3: Monthly CPI inflation trends
Exhibit 4: Manufacturing and services PMI
56.0
Mfg. PMI
Services PMI
(%)
7.0
54.0
6.1
5.8
6.0
52.0
5.1
5.0
4.3
4.2
50.0
3.9
3.6
3.7
4.0
3.4
3.2
3.0
48.0
3.0
2.2
46.0
2.0
44.0
1.0
42.0
-
Source: Market, Angel Research; Note: Level above 50 indicates expansion
Source: MOSPI, Angel Research
Exhibit 5: Exports and imports growth trends
Exhibit 6: Key policy rates
(%)
Exports yoy growth
Imports yoy growth
(%)
Repo rate
Reverse Repo rate
CRR
60.0
7.00
50.0
6.50
40.0
6.00
30.0
5.50
20.0
5.00
10.0
4.50
0.0
4.00
(10.0)
(20.0)
3.50
(30.0)
3.00
Source: Bloomberg, Angel Research
Source: RBI, Angel Research
Market Outlook
July 6, 2017
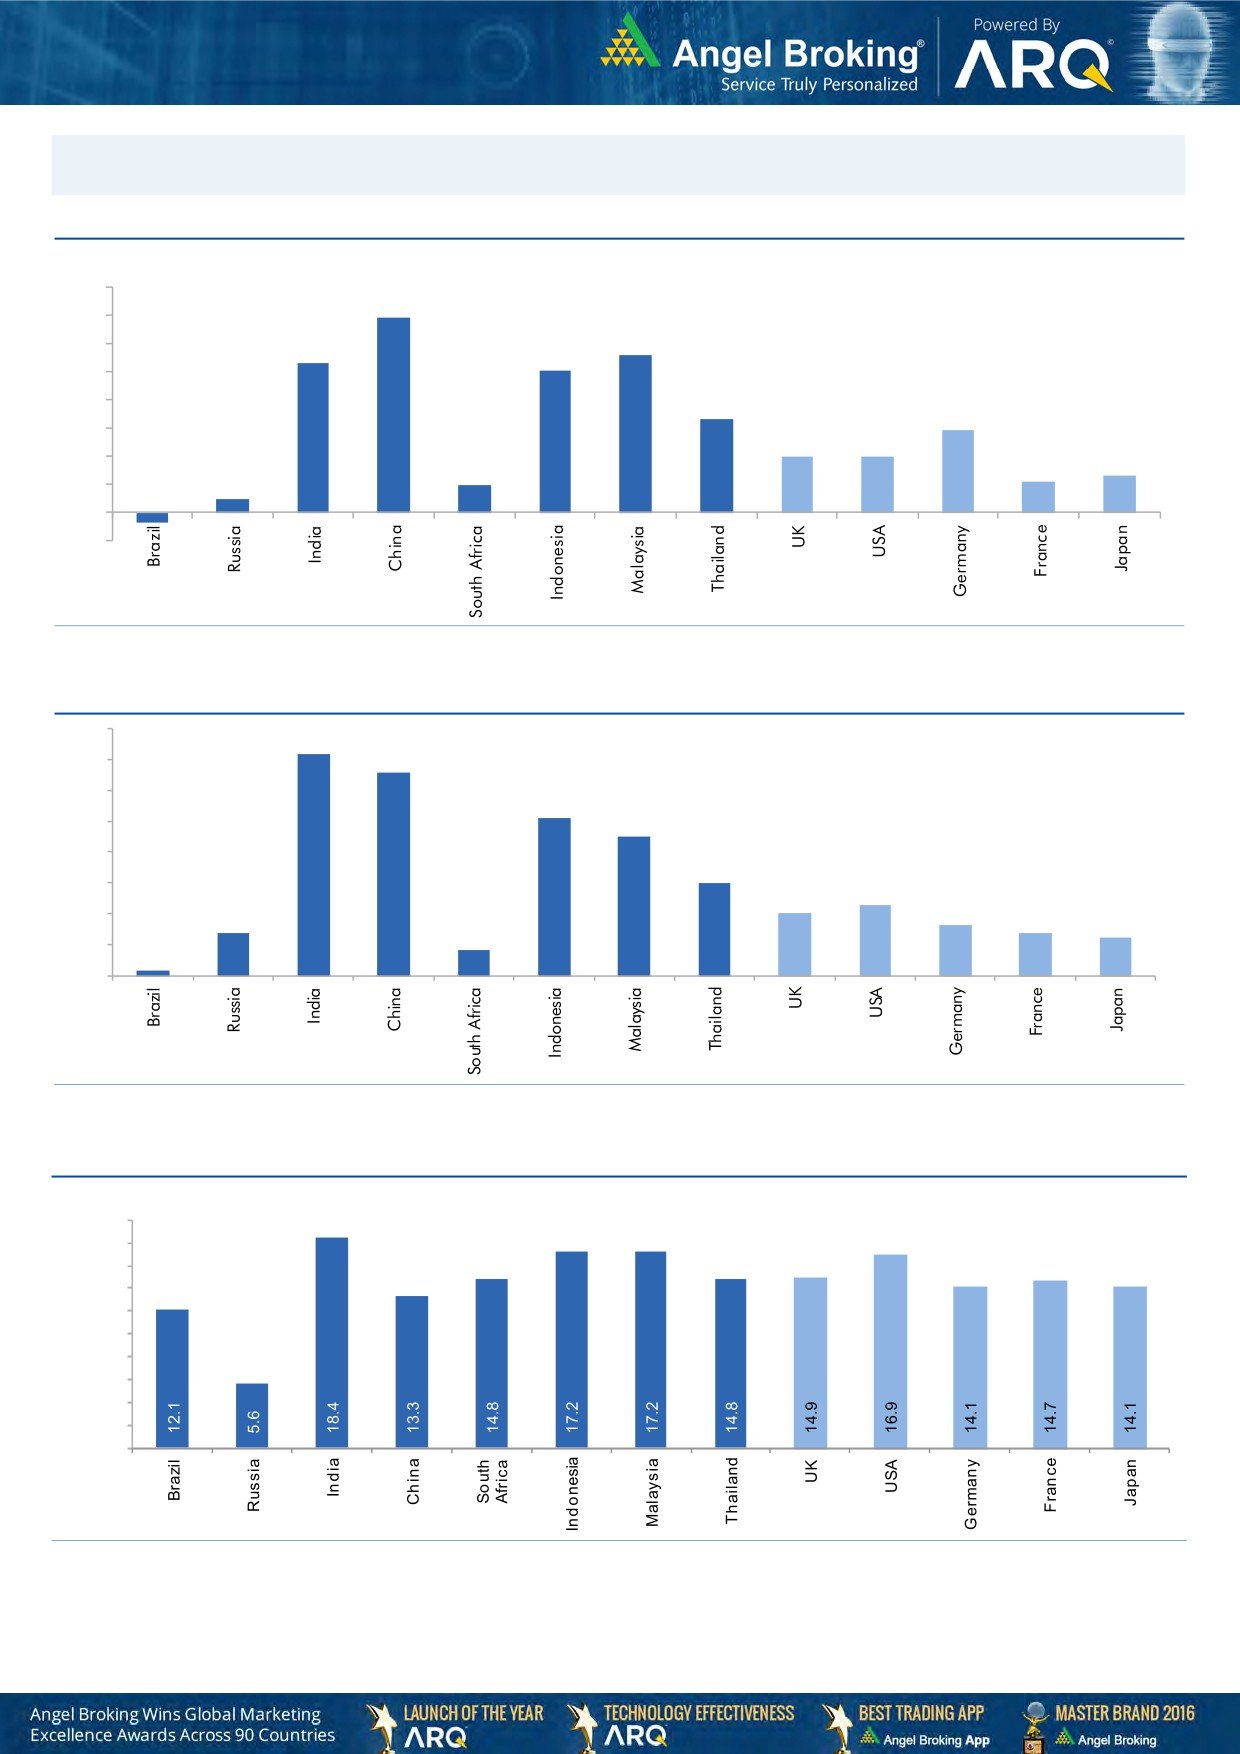
Global watch
Exhibit 1: Latest quarterly GDP Growth (%, yoy) across select developing and developed countries
(%)
8.0
6.9
7.0
5.6
6.0
5.3
5.0
1.0
5.0
4.0
3.3
2.9
3.0
2.0
2.0
0.5
2.0
1.1
1.3
1.0
-
(1.0)
(0.4)
Source: Bloomberg, Angel Research
Exhibit 2: 2016 GDP Growth projection by IMF (%, yoy) across select developing and developed countries
(%)
7.2
6.6
7.0
6.0
5.1
5.0
4.5
4.0
3.0
3.0
2.3
2.0
1.4
1.6
2.0
1.4
1.2
0.2
0.8
1.0
-
Source: IMF, Angel Research
Exhibit 3: One year forward P-E ratio across select developing and developed countries
(x)
20.0
18.0
16.0
14.0
12.0
10.0
8.0
6.0
4.0
2.0
-
Source: IMF, Angel Research
Market Outlook
July 6, 2017
Exhibit 4: Relative performance of indices across globe
Returns (%)
Country
Name of index
Closing price
1M
3M
1YR
Brazil
Bovespa
63,154
1.5
(3.1)
22.7
Russia
Micex
1,921
1.9
(3.9)
1.9
India
Nifty
9,638
(0.2)
5.1
17.5
China
Shanghai Composite
3,207
3.7
(0.1)
10.9
South Africa
Top 40
46,241
(0.8)
2.0
0.2
Mexico
Mexbol
50,301
1.5
3.1
9.2
Indonesia
LQ45
979
2.8
6.1
19.0
Malaysia
KLCI
1,768
0.1
1.1
8.2
Thailand
SET 50
996
0.8
(0.5)
10.1
USA
Dow Jones
21,478
1.6
3.9
20.4
UK
FTSE
7,368
(2.1)
0.6
12.8
Japan
Nikkei
20,082
(0.4)
5.8
31.1
Germany
DAX
12,454
(2.9)
1.1
26.6
France
CAC
5,180
(2.3)
1.9
19.6
Source: Bloomberg, Angel Research,
Stock Watch
July 06, 2017
Company Name
Reco
CMP
Target
Mkt Cap
Sales ( Čcr )
OPM(%)
EPS (Č)
PER(x)
P/BV(x)
RoE(%)
EV/Sales(x)
(Č)
Price ( Č)
( Č cr )
FY17E FY18E
FY17E
FY18E
FY17E
FY18E
FY17E
FY18E
FY17E
FY18E
FY17E
FY18E
FY17E
FY18E
Agri / Agri Chemical
Rallis
Reduce
244
209
4,752
1,937
2,164
13.3
14.3
9.0
11.0
27.2
22.2
4.7
4.1
18.4
19.8
2.5
2.2
United Phosphorus
Neutral
853
-
43,338
15,176
17,604
18.5
18.5
37.4
44.6
22.8
19.1
4.5
3.7
21.4
21.2
3.0
2.5
Auto & Auto Ancillary
Ashok Leyland
Accumulate
102
116
29,748
20,019
22,789
11.1
11.7
4.3
5.5
23.7
18.6
4.6
4.1
19.4
22.0
1.4
1.2
Bajaj Auto
Neutral
2,772
-
80,207
25,093
27,891
19.5
19.2
143.9
162.5
19.3
17.1
5.4
4.6
30.3
29.4
2.9
2.6
Bharat Forge
Neutral
1,111
-
25,869
7,726
8,713
20.5
21.2
35.3
42.7
31.5
26.0
5.8
5.3
18.9
20.1
3.4
3.0
Eicher Motors
Neutral
28,067
-
76,404
16,583
20,447
17.5
18.0
598.0
745.2
46.9
37.7
16.0
12.2
41.2
38.3
4.4
3.5
Gabriel India
Neutral
149
-
2,142
1,544
1,715
9.0
9.3
5.4
6.3
27.6
23.7
5.2
4.6
18.9
19.5
1.3
1.2
Hero Motocorp
Neutral
3,707
-
74,029
28,120
30,753
15.2
15.6
169.1
189.2
21.9
19.6
7.6
6.3
30.8
28.2
2.5
2.2
Jamna Auto Industries Neutral
267
-
2,130
1,486
1,620
9.8
9.9
15.0
17.2
17.8
15.5
3.9
3.3
21.8
21.3
1.5
1.4
L G Balakrishnan & Bros Neutral
772
-
1,212
1,302
1,432
11.6
11.9
43.7
53.0
17.7
14.6
2.5
2.3
13.8
14.2
1.0
0.9
Mahindra and Mahindra Neutral
1,385
-
86,024
46,534
53,077
11.6
11.7
67.3
78.1
20.6
17.7
3.3
2.9
15.4
15.8
1.8
1.6
Maruti
Buy
7,371
8,495
222,668
67,822
83,717
15.2
15.0
243.0
291.5
30.3
25.3
6.9
5.7
22.9
22.4
3.0
2.3
Minda Industries
Neutral
672
-
5,806
2,728
3,042
9.0
9.1
68.2
86.2
9.9
7.8
2.2
1.8
23.8
24.3
2.2
1.9
Motherson Sumi
Neutral
306
-
64,353
45,896
53,687
7.8
8.3
13.0
16.1
23.4
19.0
7.6
6.0
34.7
35.4
1.5
1.2
Rane Brake Lining
Neutral
1,342
-
1,062
511
562
11.3
11.5
28.1
30.9
47.8
43.4
7.3
6.6
15.3
15.0
2.2
2.0
Setco Automotive
Neutral
40
-
536
741
837
13.0
13.0
15.2
17.0
2.6
2.4
0.4
0.4
15.8
16.3
1.1
1.0
Tata Motors
Neutral
432
-
124,748
300,209
338,549
8.9
8.4
42.7
54.3
10.1
8.0
1.6
1.4
15.6
17.2
0.5
0.5
TVS Motor
Neutral
547
-
26,004
13,390
15,948
6.9
7.1
12.8
16.5
42.9
33.1
10.7
8.5
26.3
27.2
2.0
1.6
Amara Raja Batteries
Accumulate
848
962
14,480
5,339
6,220
15.9
15.3
28.0
32.3
30.3
26.2
5.8
4.9
19.1
18.5
2.7
2.3
Exide Industries
Neutral
228
-
19,389
7,439
8,307
15.0
15.0
8.1
9.3
28.2
24.5
3.9
3.5
14.3
16.7
2.2
2.0
Apollo Tyres
Neutral
255
-
12,967
12,877
14,504
14.3
13.9
21.4
23.0
11.9
11.1
1.9
1.6
16.4
15.2
1.2
1.1
Ceat
Neutral
1,865
-
7,545
7,524
8,624
13.0
12.7
131.1
144.3
14.2
12.9
2.6
2.2
19.8
18.6
1.1
0.9
JK Tyres
Neutral
170
-
3,852
7,455
8,056
15.0
15.0
21.8
24.5
7.8
6.9
1.6
1.3
22.8
21.3
0.6
0.6
Swaraj Engines
Neutral
2,348
-
2,916
660
810
15.2
16.4
54.5
72.8
43.1
32.3
13.4
12.2
31.5
39.2
4.2
3.4
Subros
Neutral
253
-
1,519
1,488
1,681
11.7
11.9
6.4
7.2
39.6
35.3
4.2
3.8
10.8
11.4
1.3
1.1
Indag Rubber
Neutral
210
-
551
286
326
19.8
16.8
11.7
13.3
17.9
15.7
3.0
2.8
17.8
17.1
1.6
1.4
Capital Goods
ACE
Neutral
73
-
723
709
814
4.1
4.6
1.4
2.1
52.2
34.8
2.2
2.0
4.4
6.0
1.2
1.0
BEML
Neutral
1,568
-
6,530
3,451
4,055
6.3
9.2
31.4
57.9
49.9
27.1
3.0
2.7
6.3
10.9
2.0
1.7
Bharat Electronics
Neutral
170
-
37,882
8,137
9,169
16.8
17.2
58.7
62.5
2.9
2.7
0.5
0.4
44.6
46.3
3.6
3.3
Stock Watch
July 06, 2017
Company Name
Reco
CMP
Target
Mkt Cap
Sales ( Čcr )
OPM(%)
EPS (Č)
PER(x)
P/BV(x)
RoE(%)
EV/Sales(x)
(Č)
Price ( Č)
( Č cr )
FY17E
FY18E
FY17E
FY18E
FY17E
FY18E
FY17E
FY18E
FY17E
FY18E
FY17E
FY18E
FY17E
FY18E
Capital Goods
Voltas
Neutral
475
-
15,725
6,511
7,514
7.9
8.7
12.9
16.3
36.8
29.2
6.6
5.8
16.7
18.5
2.2
1.8
BGR Energy
Neutral
154
-
1,109
16,567
33,848
6.0
5.6
7.8
5.9
19.7
26.1
1.1
1.1
4.7
4.2
0.2
0.1
BHEL
Neutral
134
-
32,859
28,797
34,742
-
2.8
2.3
6.9
58.4
19.5
1.0
1.0
1.3
4.8
0.8
0.6
Blue Star
Buy
612
760
5,849
4,283
5,077
5.9
7.3
14.9
22.1
41.1
27.6
8.0
6.7
20.4
26.4
1.4
1.2
CG Power and Industrial
Neutral
83
-
5,202
5,777
6,120
5.9
7.0
3.3
4.5
25.2
18.4
1.1
1.1
4.4
5.9
0.9
0.7
Solutions
Greaves Cotton
Neutral
160
-
3,916
1,755
1,881
16.8
16.9
7.8
8.5
20.6
18.9
4.1
3.8
20.6
20.9
1.9
1.8
Inox Wind
Neutral
146
-
3,239
5,605
6,267
15.7
16.4
24.8
30.0
5.9
4.9
1.6
1.2
25.9
24.4
0.6
0.5
KEC International
Neutral
257
-
6,608
9,294
10,186
7.9
8.1
9.9
11.9
26.0
21.6
3.8
3.3
15.6
16.3
0.9
0.9
KEI Industries
Accumulate
234
258
1,822
2,633
3,001
10.4
10.0
12.7
13.0
18.4
18.0
3.9
3.3
21.4
18.2
0.9
0.8
Thermax
Neutral
935
-
11,138
5,421
5,940
7.3
7.3
25.7
30.2
36.4
31.0
4.4
4.0
12.2
13.1
1.9
1.8
VATech Wabag
Neutral
680
-
3,712
3,136
3,845
8.9
9.1
26.0
35.9
26.2
18.9
3.3
2.8
13.4
15.9
1.1
0.9
Cement
ACC
Neutral
1,596
-
29,977
11,225
13,172
13.2
16.9
44.5
75.5
35.9
21.1
3.4
3.1
11.2
14.2
2.7
2.3
Ambuja Cements
Neutral
252
-
50,118
9,350
10,979
18.2
22.5
5.8
9.5
43.5
26.6
3.7
3.3
10.2
12.5
5.4
4.6
India Cements
Neutral
205
-
6,331
4,364
4,997
18.5
19.2
7.9
11.3
26.0
18.2
1.9
1.8
8.0
8.5
2.2
1.9
JK Cement
Neutral
980
-
6,851
4,398
5,173
15.5
17.5
31.2
55.5
31.4
17.7
3.8
3.3
12.0
15.5
2.1
1.8
J K Lakshmi Cement
Neutral
475
-
5,586
2,913
3,412
14.5
19.5
7.5
22.5
63.3
21.1
3.9
3.3
12.5
18.0
2.5
2.1
Orient Cement
Neutral
152
-
3,121
2,114
2,558
18.5
20.5
8.1
11.3
18.8
13.5
2.8
2.3
9.0
14.0
2.1
1.6
UltraTech Cement
Neutral
4,080
-
112,001
25,768
30,385
21.0
23.5
111.0
160.0
36.8
25.5
4.7
4.1
13.5
15.8
4.4
3.7
Construction
ITNL
Neutral
98
-
3,230
8,946
10,017
31.0
31.6
8.1
9.1
12.1
10.8
0.5
0.5
4.2
5.0
3.7
3.4
KNR Constructions
Neutral
207
-
2,911
1,385
1,673
14.7
14.0
41.2
48.5
5.0
4.3
0.9
0.8
14.9
15.2
2.2
1.8
Larsen & Toubro
Neutral
1,696
-
158,265
111,017
124,908
11.0
11.0
61.1
66.7
27.8
25.4
3.3
3.1
13.1
12.9
2.5
2.3
Gujarat Pipavav Port
Neutral
150
-
7,252
705
788
52.2
51.7
5.0
5.6
30.0
26.8
3.0
2.7
11.2
11.2
9.9
8.4
Nagarjuna Const.
Neutral
91
-
5,034
8,842
9,775
9.1
8.8
5.3
6.4
17.1
14.2
1.4
1.2
8.2
9.1
0.7
0.6
PNC Infratech
Neutral
144
-
3,695
2,350
2,904
13.1
13.2
9.0
8.8
16.0
16.4
0.6
0.5
15.9
13.9
1.7
1.4
Simplex Infra
Neutral
556
-
2,751
6,829
7,954
10.5
10.5
31.4
37.4
17.7
14.9
1.8
1.7
9.9
13.4
0.8
0.7
Power Mech Projects
Neutral
589
-
867
1,801
2,219
12.7
14.6
72.1
113.9
8.2
5.2
1.5
1.3
16.8
11.9
0.5
0.4
Sadbhav Engineering
Neutral
305
-
5,228
3,598
4,140
10.3
10.6
9.0
11.9
33.9
25.6
3.5
3.1
9.9
11.9
1.7
1.5
NBCC
Neutral
206
-
18,549
7,428
9,549
7.9
8.6
8.2
11.0
25.1
18.7
1.3
1.0
28.2
28.7
2.2
1.7
MEP Infra
Neutral
126
-
2,051
1,877
1,943
30.6
29.8
3.0
4.2
42.1
30.0
20.4
13.7
0.6
0.6
2.5
2.3
Stock Watch
July 06, 2017
Company Name
Reco
CMP
Target
Mkt Cap
Sales ( Čcr )
OPM(%)
EPS (Č)
PER(x)
P/BV(x)
RoE(%)
EV/Sales(x)
(Č)
Price ( Č)
( Č cr )
FY17E
FY18E
FY17E
FY18E
FY17E
FY18E
FY17E
FY18E
FY17E
FY18E
FY17E
FY18E
FY17E
FY18E
Construction
SIPL
Neutral
110
-
3,874
1,036
1,252
65.5
66.2
(8.4)
(5.6)
4.1
4.7
(22.8)
(15.9)
12.0
9.9
Engineers India
Neutral
157
-
10,570
1,725
1,935
16.0
19.1
11.4
13.9
13.8
11.3
1.9
1.8
13.4
15.3
5.1
4.5
Financials
Axis Bank
Accumulate
514
580
123,154
46,932
53,575
3.5
3.4
32.4
44.6
15.9
11.5
2.0
1.8
13.6
16.5
-
-
Bank of Baroda
Neutral
161
-
37,062
19,980
23,178
1.8
1.8
11.5
17.3
14.0
9.3
1.6
1.3
8.3
10.1
-
-
Canara Bank
Neutral
333
-
19,866
15,225
16,836
1.8
1.8
14.5
28.0
22.9
11.9
1.6
1.3
5.8
8.5
-
-
Can Fin Homes
Neutral
3,231
-
8,600
420
526
3.5
3.5
86.5
107.8
37.4
30.0
8.0
6.6
23.6
24.1
-
-
Cholamandalam Inv. &
Accumulate
1,117
1,230
17,459
2,012
2,317
6.3
6.3
42.7
53.6
26.2
20.8
4.1
3.6
16.9
18.3
-
-
Fin. Co.
Dewan Housing Finance Buy
436
520
13,665
2,225
2,688
2.9
2.9
29.7
34.6
14.7
12.6
2.4
1.6
16.1
14.8
-
-
Equitas Holdings
Buy
159
235
5,368
939
1,281
11.7
11.5
5.8
8.2
27.4
19.4
2.4
2.1
10.9
11.5
-
-
Federal Bank
Accumulate
115
125
22,286
8,259
8,995
3.0
3.0
4.3
5.6
26.7
20.5
2.3
2.1
8.5
10.1
-
-
HDFC
Neutral
1,629
-
259,546
11,475
13,450
3.4
3.4
45.3
52.5
36.0
31.0
6.9
6.1
20.2
20.5
-
-
HDFC Bank
Neutral
1,651
-
424,845
46,097
55,433
4.5
4.5
58.4
68.0
28.3
24.3
5.0
4.1
18.8
18.6
-
-
ICICI Bank
Accumulate
293
315
187,639
42,800
44,686
3.1
3.3
18.0
21.9
16.3
13.4
2.2
2.0
11.1
12.3
-
-
Karur Vysya Bank
Accumulate
144
160
8,684
5,640
6,030
3.3
3.2
8.9
10.0
16.2
14.4
1.7
1.6
11.2
11.4
-
-
Lakshmi Vilas Bank
Neutral
208
-
3,981
3,339
3,799
2.7
2.8
11.0
14.0
18.9
14.8
2.0
1.8
11.2
12.7
-
-
LIC Housing Finance
Neutral
752
-
37,943
3,712
4,293
2.6
2.5
39.0
46.0
19.3
16.3
3.6
3.1
19.9
20.1
-
-
Punjab Natl.Bank
Neutral
137
-
29,164
23,532
23,595
2.3
2.4
6.8
12.6
20.2
10.9
3.1
2.2
3.3
6.5
-
-
RBL Bank
Neutral
524
-
19,744
1,783
2,309
2.6
2.6
12.7
16.4
41.3
32.0
4.5
4.0
12.8
13.3
-
-
Repco Home Finance
Neutral
811
-
5,074
388
457
4.5
4.2
30.0
38.0
27.0
21.3
4.5
3.8
18.0
19.2
-
-
South Ind.Bank
Neutral
28
-
5,004
6,435
7,578
2.5
2.5
2.7
3.1
10.3
9.0
1.3
1.1
10.1
11.2
-
-
St Bk of India
Neutral
275
-
237,381
88,650
98,335
2.6
2.6
13.5
18.8
20.4
14.6
1.9
1.7
7.0
8.5
-
-
Union Bank
Neutral
149
-
10,267
13,450
14,925
2.3
2.3
25.5
34.5
5.9
4.3
0.9
0.7
7.5
10.2
-
-
Yes Bank
Neutral
1,504
-
68,818
8,978
11,281
3.3
3.4
74.0
90.0
20.3
16.7
3.9
3.3
17.0
17.2
-
-
FMCG
Akzo Nobel India
Neutral
1,833
-
8,791
2,955
3,309
13.3
13.7
57.2
69.3
32.1
26.4
10.5
8.8
32.7
33.3
2.8
2.4
Asian Paints
Neutral
1,126
-
108,034
17,128
18,978
16.8
16.4
19.1
20.7
59.0
54.4
20.5
19.4
34.8
35.5
6.2
5.6
Britannia
Neutral
3,733
-
44,800
9,594
11,011
14.6
14.9
80.3
94.0
46.5
39.7
19.1
14.8
41.2
-
4.5
3.9
Colgate
Neutral
1,114
-
30,306
4,605
5,149
23.4
23.4
23.8
26.9
46.8
41.4
25.9
20.3
64.8
66.8
6.5
5.8
Dabur India
Neutral
298
-
52,449
8,315
9,405
19.8
20.7
8.1
9.2
36.8
32.4
10.2
8.5
31.6
31.0
6.0
5.2
GlaxoSmith Con*
Neutral
5,504
-
23,146
4,350
4,823
21.2
21.4
179.2
196.5
30.7
28.0
8.2
6.9
27.1
26.8
4.7
4.2
Stock Watch
July 06, 2017
Company Name
Reco
CMP
Target
Mkt Cap
Sales ( Čcr )
OPM(%)
EPS (Č)
PER(x)
P/BV(x)
RoE(%)
EV/Sales(x)
(Č)
Price ( Č)
( Č cr )
FY17E FY18E
FY17E
FY18E
FY17E
FY18E
FY17E
FY18E
FY17E
FY18E
FY17E
FY18E
FY17E
FY18E
FMCG
Godrej Consumer
Neutral
983
-
66,928
10,235
11,428
18.4
18.6
41.1
44.2
23.9
22.2
5.3
4.5
24.9
24.8
6.6
5.9
HUL
Neutral
1,097
-
237,507
35,252
38,495
17.8
17.8
20.7
22.4
53.2
49.0
50.8
43.6
95.6
88.9
6.6
6.0
ITC
Neutral
331
-
402,139
40,059
44,439
38.3
39.2
9.0
10.1
36.9
32.7
10.3
9.0
27.8
27.5
9.5
8.6
Marico
Neutral
325
-
41,934
6,430
7,349
18.8
19.5
6.4
7.7
50.8
42.2
15.3
12.9
33.2
32.5
6.3
5.5
Nestle*
Neutral
6,908
-
66,606
10,073
11,807
20.7
21.5
124.8
154.2
55.4
44.8
22.7
20.4
34.8
36.7
6.4
5.5
Tata Global
Neutral
156
-
9,855
8,675
9,088
9.8
9.8
7.4
8.2
21.1
19.0
1.7
1.6
7.9
8.1
1.1
1.0
Procter & Gamble
Neutral
8,050
-
26,131
2,939
3,342
23.2
23.0
146.2
163.7
55.1
49.2
13.9
11.6
25.3
23.5
8.4
7.3
Hygiene
IT
HCL Tech^
Buy
836
1,014
119,261
46,723
52,342
22.1
20.9
60.0
62.8
13.9
13.3
3.5
3.0
25.3
22.4
2.3
1.9
Infosys
Buy
951
1,179
218,451
68,484
73,963
26.0
26.0
63.0
64.0
15.1
14.9
3.2
2.9
20.8
19.7
2.9
2.5
TCS
Accumulate
2,358
2,651
464,578
117,966
127,403
27.5
27.6
134.3
144.5
17.6
16.3
5.2
4.9
29.8
29.7
3.6
3.3
Tech Mahindra
Buy
378
533
36,872
29,141
31,051
14.4
15.0
32.3
35.6
11.7
10.6
2.0
1.8
17.1
17.0
1.1
1.0
Wipro
Accumulate
258
280
125,328
55,421
58,536
20.3
20.3
35.1
36.5
7.3
7.1
1.3
1.1
19.2
14.6
1.7
1.4
Media
D B Corp
Neutral
382
-
7,026
2,297
2,590
27.4
28.2
21.0
23.4
18.2
16.3
4.2
3.7
23.7
23.1
2.9
2.5
HT Media
Neutral
82
-
1,904
2,693
2,991
12.6
12.9
7.9
9.0
10.4
9.1
0.9
0.8
7.8
8.3
0.3
0.2
Jagran Prakashan
Buy
184
225
6,017
2,283
2,555
28.0
28.0
10.6
12.3
17.3
15.0
3.7
3.2
21.4
21.4
2.6
2.3
Sun TV Network
Neutral
824
-
32,465
2,850
3,265
70.1
71.0
26.2
30.4
31.4
27.1
8.0
7.1
24.3
25.6
11.0
9.5
Hindustan Media
Neutral
274
-
2,012
1,016
1,138
24.3
25.2
27.3
30.1
10.0
9.1
1.9
1.7
16.2
15.8
1.3
1.1
Ventures
TV Today Network
Buy
251
344
1,497
608
667
21.5
22.3
15.7
19.2
16.0
13.0
2.4
2.1
16.1
16.0
2.1
1.8
Metals & Mining
Coal India
Neutral
248
-
153,633
84,638
94,297
21.4
22.3
24.5
27.1
10.1
9.1
4.2
4.0
42.6
46.0
1.3
1.2
Hind. Zinc
Neutral
269
-
113,809
14,252
18,465
55.9
48.3
15.8
21.5
17.1
12.5
2.8
2.4
17.0
20.7
8.0
6.2
Hindalco
Neutral
199
-
44,587
107,899
112,095
7.4
8.2
9.2
13.0
21.6
15.3
1.0
1.0
4.8
6.6
0.9
0.9
JSW Steel
Neutral
212
-
51,318
53,201
58,779
16.1
16.2
130.6
153.7
1.6
1.4
0.2
0.2
14.0
14.4
1.7
1.5
NMDC
Neutral
111
-
35,167
6,643
7,284
44.4
47.7
7.1
7.7
15.7
14.4
1.4
1.3
8.8
9.2
3.1
2.7
SAIL
Neutral
60
-
24,615
47,528
53,738
(0.7)
2.1
(1.9)
2.6
22.9
0.7
0.6
(1.6)
3.9
1.4
1.2
Vedanta
Neutral
261
-
97,167
71,744
81,944
19.2
21.7
13.4
20.1
19.5
13.0
1.7
1.5
8.4
11.3
1.7
1.4
Tata Steel
Neutral
550
-
53,393
121,374
121,856
7.2
8.4
18.6
34.3
29.6
16.0
1.8
1.7
6.1
10.1
1.1
1.1
Oil & Gas
GAIL
Neutral
363
-
61,386
56,220
65,198
9.3
10.1
27.1
33.3
13.4
10.9
1.2
1.1
9.3
10.7
1.3
1.1
ONGC
Neutral
163
-
208,733
137,222
152,563
15.0
21.8
19.5
24.1
8.3
6.8
0.7
0.7
8.5
10.1
1.8
1.6
Indian Oil Corp
Neutral
386
-
187,292
373,359
428,656
5.9
5.5
54.0
59.3
7.1
6.5
1.1
1.0
16.0
15.6
0.7
0.6
Stock Watch
July 06, 2017
Company Name
Reco
CMP
Target
Mkt Cap
Sales ( Čcr )
OPM(%)
EPS (Č)
PER(x)
P/BV(x)
RoE(%)
EV/Sales(x)
(Č)
Price ( Č)
( Č cr )
FY17E FY18E
FY17E
FY18E
FY17E
FY18E
FY17E
FY18E
FY17E
FY18E
FY17E
FY18E
FY17E
FY18E
Oil & Gas
Reliance Industries
Neutral
1,440
-
468,160
301,963
358,039
12.1
12.6
87.7
101.7
16.4
14.2
1.7
1.5
10.7
11.3
2.0
1.7
Pharmaceuticals
Alembic Pharma
Buy
519
648
9,787
3,101
3,966
19.7
20.5
21.4
25.5
24.3
20.4
5.2
4.2
23.0
22.8
3.1
2.3
Alkem Laboratories Ltd
Buy
1,836
2,161
21,950
5,853
6,901
17.1
18.4
74.6
85.0
24.6
21.6
5.2
4.4
21.1
20.2
3.7
3.2
Aurobindo Pharma
Buy
679
823
39,770
14,845
17,086
21.5
22.1
39.4
44.7
17.2
15.2
4.2
3.4
27.6
24.7
2.8
2.4
Aventis*
Neutral
4,190
-
9,649
2,206
2,508
16.6
16.8
128.9
139.9
32.5
30.0
5.6
4.4
21.6
23.5
4.1
3.5
Cadila Healthcare
Reduce
516
450
52,871
9,220
11,584
18.4
20.3
14.5
18.7
35.6
27.6
7.6
6.2
23.5
24.6
6.1
4.6
Cipla
Sell
546
461
43,905
14,281
16,619
15.4
16.2
12.5
19.7
43.7
27.7
3.5
3.2
8.4
12.0
3.2
2.8
Dr Reddy's
Neutral
2,658
-
44,056
14,081
15,937
16.1
18.6
72.6
105.9
36.6
25.1
3.6
3.2
9.6
13.6
3.4
3.0
Dishman Pharma
Sell
143
1,718
1,890
22.7
22.8
9.5
11.3
10.1
10.9
3.3
2.9
GSK Pharma*
Neutral
2,566
-
21,736
2,927
3,290
11.8
16.2
34.4
49.6
74.6
51.7
10.8
11.3
13.9
21.3
7.2
6.5
Indoco Remedies
Sell
202
153
1,862
1,067
1,154
12.1
14.9
8.4
11.3
24.1
17.9
2.9
2.5
12.6
15.0
1.9
1.8
Ipca labs
Buy
481
620
6,063
3,211
3,593
13.9
14.5
15.4
19.4
31.2
24.8
2.5
2.3
8.2
9.5
2.0
1.8
Lupin
Buy
1,084
1,526
48,969
17,120
18,657
24.1
24.1
56.9
61.1
19.1
17.7
3.6
3.0
20.7
18.6
3.2
2.6
Natco Pharma
Accumulate
984
1,060
17,152
2,065
1,988
33.1
33.7
27.9
25.7
35.3
38.3
10.3
8.8
29.2
22.9
8.4
8.5
Sun Pharma
Buy
551
712
132,102
30,264
32,899
29.0
26.9
32.7
31.6
16.8
17.4
3.6
3.1
22.2
18.7
4.1
3.7
Power
Tata Power
Neutral
82
-
22,112
36,916
39,557
17.4
27.1
5.1
6.3
16.0
13.0
1.4
1.3
9.0
10.3
1.6
1.5
NTPC
Neutral
159
-
130,938
86,605
95,545
17.5
20.8
11.8
13.4
13.5
11.9
1.4
1.3
10.5
11.1
2.9
2.8
Power Grid
Accumulate
210
223
109,968
25,315
29,193
88.2
88.7
14.2
17.2
14.9
12.3
2.3
2.0
15.2
16.1
9.0
8.1
Real Estate
Prestige Estate
Neutral
250
-
9,368
4,707
5,105
25.2
26.0
10.3
13.0
24.3
19.2
1.9
1.8
10.3
10.2
3.2
2.8
MLIFE
Buy
439
522
2,251
1,152
1,300
22.7
24.6
29.9
35.8
14.7
12.3
1.1
1.0
7.6
8.6
2.7
2.3
Telecom
Bharti Airtel
Neutral
376
-
150,422
105,086
114,808
34.5
34.7
12.2
16.4
30.8
23.0
2.1
2.0
6.8
8.4
2.3
2.0
Idea Cellular
Neutral
84
-
30,129
40,133
43,731
37.2
37.1
6.4
6.5
13.1
12.9
1.1
1.0
8.2
7.6
1.8
1.5
zOthers
Abbott India
Neutral
4,226
-
8,980
3,153
3,583
14.1
14.4
152.2
182.7
27.8
23.1
136.3
116.4
25.6
26.1
2.6
2.2
Asian Granito
Accumulate
446
480
1,341
1,066
1,169
11.6
12.5
13.0
16.0
34.3
27.9
3.3
3.0
9.5
10.7
1.6
1.4
Bajaj Electricals
Buy
323
395
3,271
4,801
5,351
5.7
6.2
10.4
13.7
31.0
23.6
3.8
3.4
12.4
14.5
0.7
0.6
Banco Products (India)
Neutral
219
-
1,564
1,353
1,471
12.3
12.4
14.5
16.3
15.1
13.4
20.8
18.8
14.5
14.6
1.1
117.8
Coffee Day Enterprises
Neutral
248
-
5,113
2,964
3,260
20.5
21.2
4.7
8.0
-
31.0
2.9
2.6
5.5
8.5
2.1
1.9
Ltd
Competent Automobiles Neutral
191
-
122
1,137
1,256
3.1
2.7
28.0
23.6
6.8
8.1
36.7
33.2
14.3
11.5
0.1
0.1
Elecon Engineering
Neutral
60
-
675
1,482
1,660
13.7
14.5
3.9
5.8
15.4
10.4
3.6
3.3
7.8
10.9
0.8
0.7
Stock Watch
July 06, 2017
Company Name
Reco
CMP
Target
Mkt Cap
Sales ( Čcr )
OPM(%)
EPS (Č)
PER(x)
P/BV(x)
RoE(%)
EV/Sales(x)
(Č)
Price ( Č)
( Č cr )
FY17E
FY18E
FY17E
FY18E
FY17E
FY18E
FY17E
FY18E
FY17E
FY18E
FY17E
FY18E
FY17E
FY18E
zOthers
Finolex Cables
Neutral
485
-
7,420
2,883
3,115
12.0
12.1
14.2
18.6
34.2
26.1
18.2
15.9
15.8
14.6
2.3
2.1
Garware Wall Ropes
Neutral
878
-
1,920
863
928
15.1
15.2
36.4
39.4
24.1
22.3
4.4
3.7
17.5
15.9
2.1
2.0
Goodyear India*
Neutral
910
-
2,100
1,598
1,704
10.4
10.2
49.4
52.6
18.4
17.3
85.1
74.6
18.2
17.0
1.0
142.9
Hitachi
Neutral
1,954
-
5,313
2,081
2,433
8.8
8.9
33.4
39.9
58.5
49.0
47.2
39.3
22.1
21.4
2.6
2.2
HSIL
Neutral
404
-
2,922
2,384
2,515
15.8
16.3
15.3
19.4
26.4
20.8
26.2
22.6
7.8
9.3
1.4
1.3
Interglobe Aviation
Neutral
1,216
-
43,985
21,122
26,005
14.5
27.6
110.7
132.1
11.0
9.2
65.8
47.0
168.5
201.1
2.1
1.6
Jyothy Laboratories
Neutral
361
-
6,562
1,440
2,052
11.5
13.0
8.5
10.0
42.5
36.1
10.3
9.5
18.6
19.3
4.8
3.4
Kirloskar Engines India
Neutral
393
-
5,680
2,554
2,800
9.9
10.0
10.5
12.1
37.4
32.5
15.7
14.8
10.7
11.7
1.9
1.7
Ltd
Linc Pen & Plastics
Neutral
280
-
414
382
420
9.3
9.5
13.5
15.7
20.8
17.8
3.6
3.1
17.1
17.3
1.2
1.0
M M Forgings
Neutral
635
-
766
546
608
20.4
20.7
41.3
48.7
15.4
13.0
87.0
77.0
16.6
17.0
1.2
1.1
Manpasand Bever.
Neutral
771
-
4,409
836
1,087
19.6
19.4
16.9
23.8
45.6
32.4
5.5
4.8
12.0
14.8
5.0
3.8
Mirza International
Neutral
165
-
1,986
963
1,069
17.2
18.0
6.1
7.5
26.9
22.0
4.1
3.5
15.0
15.7
2.3
2.0
MT Educare
Neutral
64
-
254
366
417
17.7
18.2
9.4
10.8
6.8
5.9
1.5
1.3
22.2
22.3
0.6
0.5
Narayana Hrudaya
Neutral
316
-
6,465
1,873
2,166
11.5
11.7
2.6
4.0
119.6
79.8
7.3
6.6
6.1
8.3
3.6
3.1
Navkar Corporation
Buy
210
265
2,993
347
371
43.2
37.3
6.7
6.0
31.5
35.0
2.2
1.9
6.2
10.6
9.7
9.1
Navneet Education
Neutral
177
-
4,134
1,062
1,147
24.0
24.0
6.1
6.6
29.1
26.7
6.0
5.3
20.6
19.8
4.0
3.7
Nilkamal
Neutral
1,932
-
2,884
1,995
2,165
10.7
10.4
69.8
80.6
27.7
24.0
110.4
95.9
16.6
16.5
1.4
1.3
Page Industries
Neutral
17,956
-
20,028
2,450
3,124
20.1
17.6
299.0
310.0
60.1
57.9
399.9
305.3
47.1
87.5
8.2
6.5
Parag Milk Foods
Neutral
225
-
1,896
1,919
2,231
9.3
9.6
9.5
12.9
23.9
17.4
3.7
3.1
15.5
17.5
1.1
1.0
Quick Heal
Neutral
203
-
1,422
408
495
27.3
27.0
7.7
8.8
26.2
23.0
2.4
2.4
9.3
10.6
2.6
2.2
Radico Khaitan
Accumulate
134
147
1,784
1,667
1,824
13.0
13.2
6.7
8.2
20.2
16.4
1.8
1.7
9.0
10.2
1.5
1.3
Relaxo Footwears
Neutral
518
-
6,226
2,085
2,469
9.2
8.2
7.6
8.0
68.6
65.2
26.6
22.7
17.9
18.8
3.1
2.6
S H Kelkar & Co.
Neutral
260
-
3,754
1,036
1,160
15.1
15.0
6.1
7.2
42.5
36.2
4.5
4.2
10.7
11.5
3.5
3.1
Siyaram Silk Mills
Accumulate
2,200
2,500
2,062
1,574
1,769
12.5
12.7
97.1
113.1
22.7
19.5
3.5
3.0
15.4
15.5
1.5
1.3
Styrolution ABS India*
Neutral
916
-
1,610
1,440
1,537
9.2
9.0
40.6
42.6
22.6
21.5
57.6
52.3
12.3
11.6
1.1
1.0
Surya Roshni
Neutral
293
-
1,286
3,342
3,625
7.8
7.5
17.3
19.8
17.0
14.9
32.2
25.9
10.5
10.8
0.6
0.6
Team Lease Serv.
Neutral
1,436
-
2,455
3,229
4,001
1.5
1.8
22.8
32.8
63.1
43.7
6.8
5.9
10.7
13.4
0.7
0.5
The Byke Hospitality
Neutral
189
-
759
287
384
20.5
20.5
7.6
10.7
24.9
17.7
5.2
4.2
20.7
23.5
2.7
2.0
Transport Corporation of
Neutral
341
-
2,609
2,671
2,911
8.5
8.8
13.9
15.7
24.6
21.8
3.4
3.0
13.7
13.8
1.1
1.0
India
Stock Watch
July 06, 2017
Company Name
Reco
CMP
Target Mkt Cap
Sales ( Čcr )
OPM(%)
EPS (Č)
PER(x)
P/BV(x)
RoE(%)
EV/Sales(x)
(Č)
Price ( Č)
( Č cr )
FY17E FY18E FY17E FY18E FY17E FY18E FY17E FY18E FY17E FY18E FY17E FY18E FY17E FY18E
zOthers
TVS Srichakra
Neutral
3,849
-
2,947
2,304
2,614
13.7
13.8
231.1
266.6
16.7
14.4
432.5
340.5
33.9
29.3
1.3
1.1
UFO Moviez
Neutral
387
-
1,068
619
685
33.2
33.4
30.0
34.9
12.9
11.1
1.8
1.5
13.8
13.9
1.4
1.1
Visaka Industries
Neutral
510
-
810
1,051
1,138
10.3
10.4
21.0
23.1
24.3
22.0
65.4
61.2
9.0
9.2
1.0
1.0
VRL Logistics
Neutral
336
-
3,069
1,902
2,119
16.7
16.6
14.6
16.8
23.1
20.0
5.1
4.4
21.9
22.2
1.7
1.5
VIP Industries
Accumulate
193
218
2,722
1,270
1,450
10.4
10.4
5.6
6.5
34.4
29.6
7.1
6.2
20.7
21.1
2.1
1.9
Navin Fluorine
Buy
3,032
3,650
2,984
789
945
21.1
22.4
120.1
143.4
25.2
21.1
4.1
3.5
17.8
18.5
3.7
3.0
Source: Company, Angel Research; Note: *December year end; #September year end; &October year end; Price as on July 05, 2017
Market Outlook
July 06, 2017
Research Team Tel: 022 - 39357800
DISCLAIMER
Angel Broking Private Limited (hereinafter referred to as “Angel”) is a registered Member of National Stock Exchange of India
Limited,Bombay Stock Exchange Limited and Metropolitan Stock Exchange Limited. It is also registered as a Depository Participant with
CDSL and Portfolio Manager with SEBI. It also has registration with AMFI as a Mutual Fund Distributor. Angel Broking Private Limited is a
registered entity with SEBI for Research Analyst in terms of SEBI (Research Analyst) Regulations, 2014 vide registration number
INH000000164. Angel or its associates has not been debarred/ suspended by SEBI or any other regulatory authority for accessing
/dealing in securities Market. Angel or its associates/analyst has not received any compensation / managed or
co-managed public offering of securities of the company covered by Analyst during the past twelve months.
This document is solely for the personal information of the recipient, and must not be singularly used as the basis of any investment
decision. Nothing in this document should be construed as investment or financial advice. Each recipient of this document should make
such investigations as they deem necessary to arrive at an independent evaluation of an investment in the securities of the companies
referred to in this document (including the merits and risks involved), and should consult their own advisors to determine the merits and
risks of such an investment.
Reports based on technical and derivative analysis center on studying charts of a stock's price movement, outstanding positions and
trading volume, as opposed to focusing on a company's fundamentals and, as such, may not match with a report on a company's
fundamentals. Investors are advised to refer the Fundamental and Technical Research Reports available on our website to evaluate the
contrary view, if any.
The information in this document has been printed on the basis of publicly available information, internal data and other reliable
sources believed to be true, but we do not represent that it is accurate or complete and it should not be relied on as such, as this
document is for general guidance only. Angel Broking Pvt. Limited or any of its affiliates/ group companies shall not be in any way
responsible for any loss or damage that may arise to any person from any inadvertent error in the information contained in this report.
Angel Broking Pvt. Limited has not independently verified all the information contained within this document. Accordingly, we cannot
testify, nor make any representation or warranty, express or implied, to the accuracy, contents or data contained within this document.
While Angel Broking Pvt. Limited endeavors to update on a reasonable basis the information discussed in this material, there may be
regulatory, compliance, or other reasons that prevent us from doing so.
This document is being supplied to you solely for your information, and its contents, information or data may not be reproduced,
redistributed or passed on, directly or indirectly.
Neither Angel Broking Pvt. Limited, nor its directors, employees or affiliates shall be liable for any loss or damage that may arise from
or in connection with the use of this information.